
Loading…
A clean pre/post test let Peak Design swap free US shipping for a $99 threshold, lifting AOV 17% and cutting annual shipping costs without a hit to net revenue.


The brand
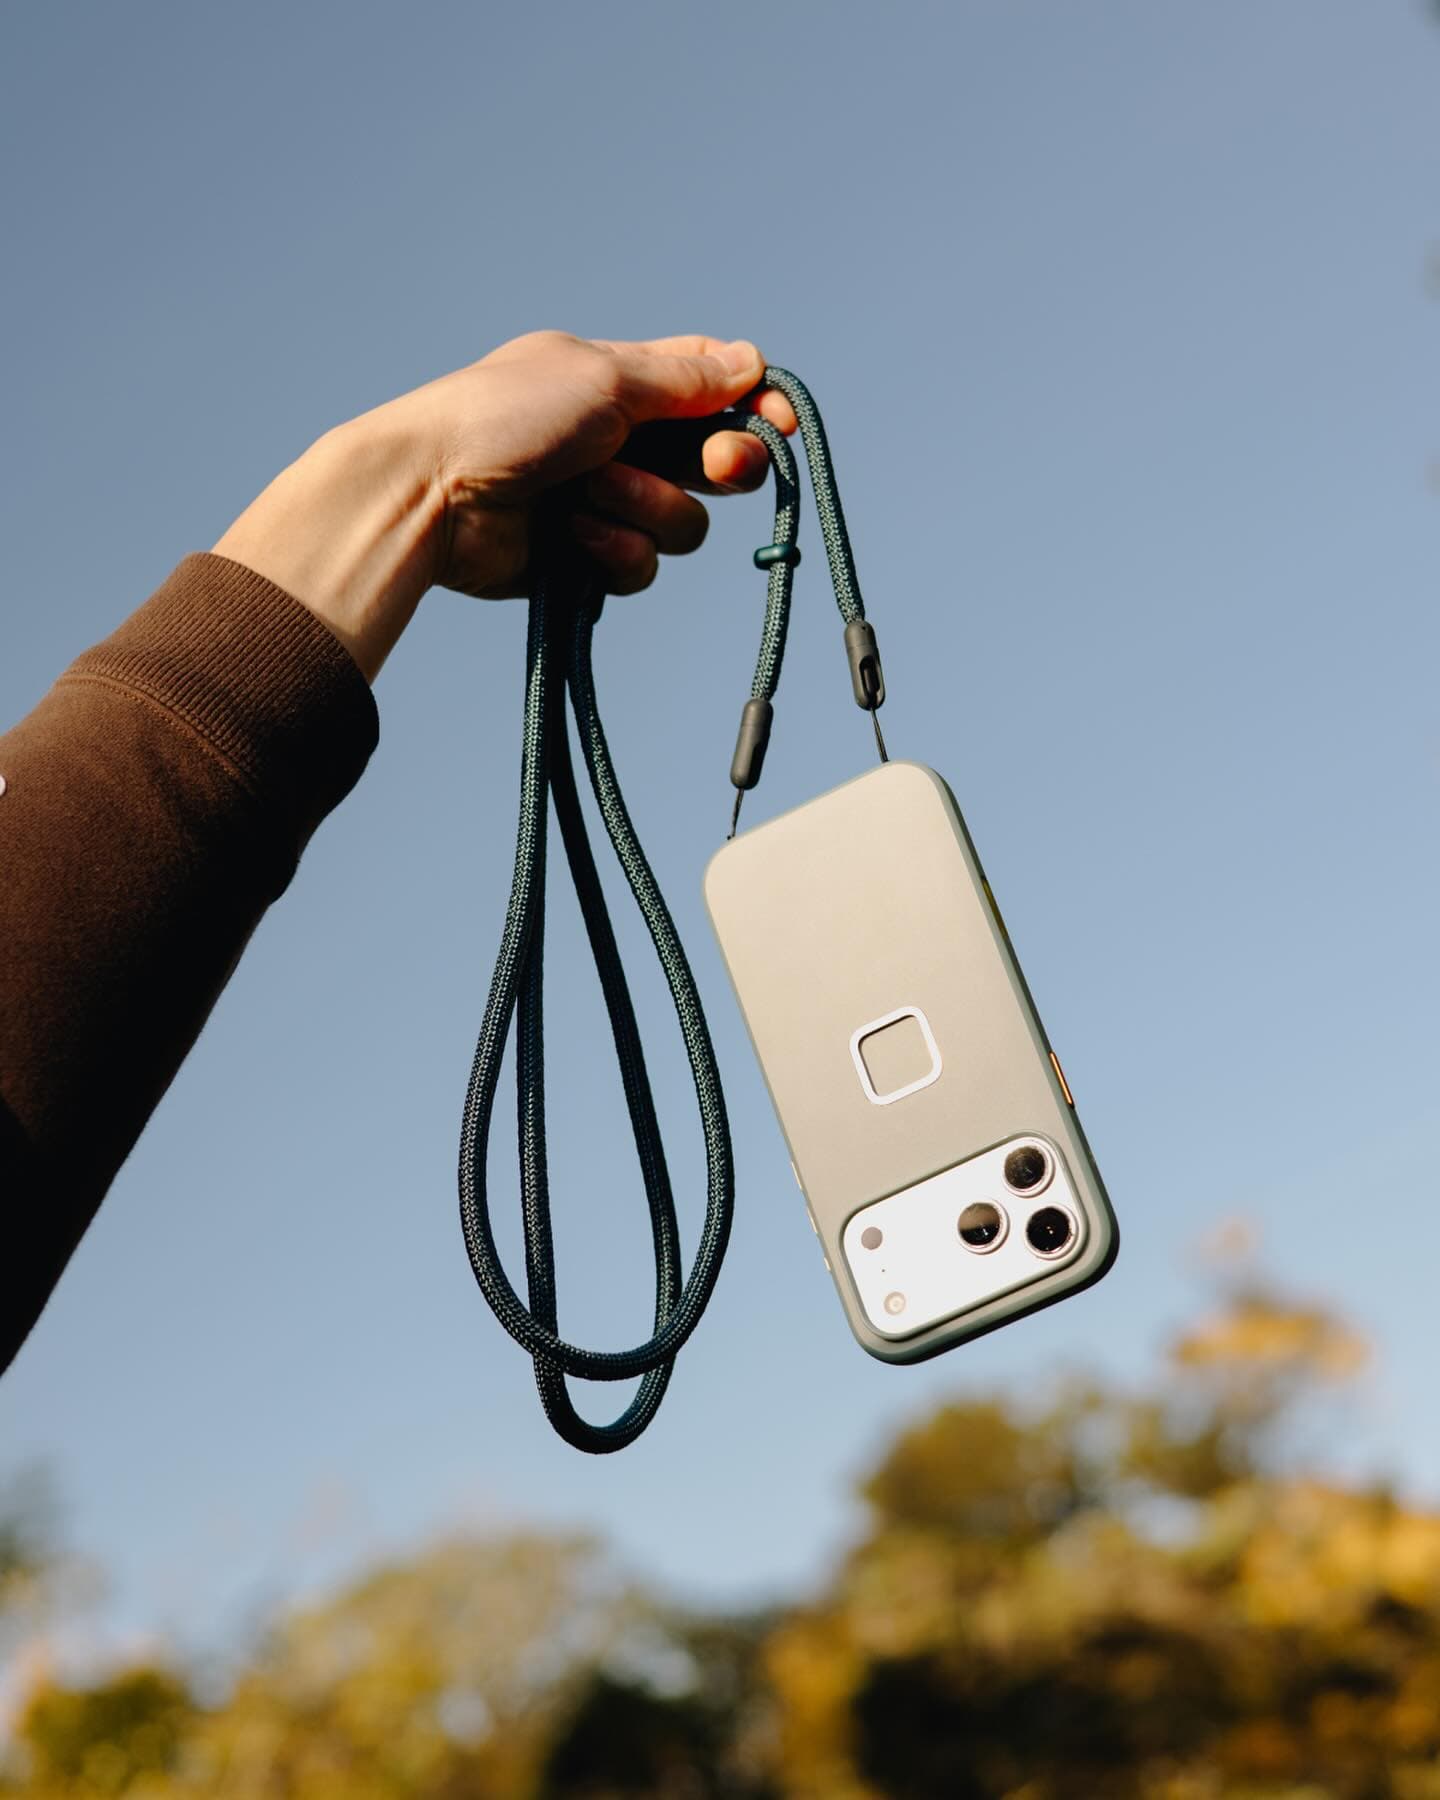
Peak Design makes precision camera bags, tripods, and travel gear for photographers and adventurers who expect the product to work as hard as they do. The brand has built a fiercely loyal community, a direct-to-consumer business model, and a price point that demands a confident on-site experience.
As shipping costs climbed, Peak Design's data revealed they were losing meaningful money on free shipping, but it wasn't obvious where to start. They needed analysis before action.
pd-162 [100%] $99 US shipping threshold, Win, ended 3/27/2023, 26-day pre/post, 325,310 sessions. Data story: 1_YZWAOCqVp3oTQvA8i9-xP5geicGLNJSydUtZAk5tug. Kbase: 1TD_cgwoOIdV1KtHAmELutM1pwghz3zjq4PR8MNmtfjA. Test Roadmap: 1TZqBIuRQUSVrVfZqtboz2F9dpmfoUijWfHP5K-j5-eI. Testimonial (id 2d0174ba): Adam Saraceno via Clutch review, confirmed authentic by Callen 2026-05-28 (Adam's writing style). 2018 reference context only: surefoot.me blog post on early A/B testing.
The impact
pd-162 data story Key Insights slide: +17% AOV vs. free shipping
pd-162 data story: +16.7% increase in transactions above $99 (rounded down to 16% per stats discipline)
When we initially looked at our shipping data, it looked like the opportunity to save on shipping costs was with international markets. But Surefoot dug in and determined it was actually the U.S. where we were losing the most revenue to free shipping. With their help, we tested the shipping threshold confidently and thoughtfully. The results were awesome and our VP of Finance and I are happy boys. More money back in the ol' profit machine!


The challenge
Internal review confirmed Peak Design was losing money on free shipping, but no one had isolated whether the loss was domestic or international. Without that, any intervention was a guess.
pd-162 data story rationale: Analysis of shipping data from the US and international markets revealed Peak Design may have been losing money on free shipping in the United States.
A free-shipping change touches the cart's most sensitive value prop. Any intervention had to be modeled, isolated, and clean enough to defend if it did not land.
pd-162 data story framing; Mike-approved test process note on title slide indicates senior-stakeholder sign-off was required.
The approach
We joined Peak's shipping dataset with order data and surfaced the answer the team didn't expect: US domestic, not international, was the primary loss.
pd-162 data story rationale + recommendation slide.
Using the combined dataset, we modeled where a free-shipping threshold would recoup the most cost while protecting AOV and conversion.
pd-162 data story hypothesis slide: We believe offering free shipping above $99, and $4.95 flat rate for orders $99 and below, will help recoup lost revenue without materially impacting conversions.
Designed and built the threshold treatment in Peak's testing tool (Convert) and coordinated the matching Shopify-side updates.
Kbase tooling: testing tool = Convert; tech stack = Shopify. pd-162 QA report doc 1LjLYhH_Db1tIawU5J0Y6qCEuS0qCl-Gr7iqD82FCthw.
Launched at 100% of US traffic for 26 days during a window with no promotions or ad anomalies, then modeled pre/post to isolate impact.
pd-162 data story credits/duration slide: 26 days (3/1 - 3/27/2023), 325,310 sessions. Test status: 100% personalization per Test Roadmap.
With the $99 threshold validated, we recommended a flat $5 sub-$99 shipping iteration and a follow-up $75 threshold test to keep tuning the curve.
pd-162 data story recommendation slide: We recommend an iteration that tests a flat $5 shipping rate for sub-$99 orders... Based on the results of that, we recommend testing a $75 threshold.
What we learned
The team expected international shipping to be the main cost. Joining the shipping and order data showed the larger loss was domestic. Running that analysis first kept the test focused and the results credible.
pd-162 data story rationale section identifies US, not international, as the loss; contradicts the going assumption.
Running the 26-day pre/post outside of promotions and ad-buy spikes kept the comparison clean. Windows affected by those swings make results harder to read and act on.
pd-162 data story duration slide: 26 days, 3/1 - 3/27/2023.
Individual cart sizes did not really change. What changed was the share of orders that fell above the $99 line. That's how a threshold can improve AOV without forcing customer behavior.
pd-162 data story AOV slide: AOV (and mean order value) for orders above and below the free shipping threshold did not change much. It's the distribution of orders that changed, which ultimately increased AOV.
The results
Over a 26-day pre/post window, swapping free US shipping for a $99 threshold lifted AOV 17% and increased orders above the free shipping threshold. Overall transactions dipped, driven entirely by sub-$99 orders, but the AOV shift offset the lost volume: net transaction revenue was directionally positive and not statistically different from baseline. The real headline number was the shipping cost line: with the new threshold absorbing the most expensive orders, Peak Design recovered hundreds of thousands of dollars per year in shipping spend that had previously been subsidized.
The takeaway
Revenue held steady, and with small orders no longer subsidizing free shipping, more of every sale became profit. A margin win, proven by a clean pre/post test.
Frequently asked
Shipping costs were rising, and free US shipping had become a meaningful line-item loss. The team needed to know where the loss was concentrated and whether a threshold could close the gap without damaging conversion.
Kbase business goals + pd-162 rationale slide.
Data analysis, A/B and pre/post testing, and Shopify front-end development. The shipping threshold work in particular leaned on data engineering (joining shipping with order data) and a clean experimentation cadence.
Kbase tooling + engineering sections.
Multi-year and ongoing. Peak Design has been a Surefoot partner since 2018, and the program has continued through site rebuilds, product launches, and tooling migrations.
Test Roadmap: pd-1 dated 5/8/2018 (earliest). Most recent activity pd-203+ dating to 2024+. Kbase active engagement.
Direction over magnitude. Pre/post tests on shipping economics tend to surface real margin wins, but the magnitude depends on the gap between what a brand is absorbing and what the market will tolerate. The discipline of running a clean window is what makes the result actionable.
Directional language per case-study evidence honesty rules: no headline % offered, results vary by brand.

Modern Home & Living
A CRO program scored on what a lead was worth, not just how many came in
Read case study
Sports & Recreation
Building a conversion program that respects what shoppers already know.
Read case study
Beauty & Wellness
Their redesign was ready. We helped them know it would land before they pushed it live.
Read case study